
 Home - TDLAS modules - Applications - Application Case :T-type cell mediated photoacoustic spectroscopy for simultaneous detection of multi-component gases based on triple resonance modality
 Recently, the joint research team from School of Optoelectronic Engineering, Xidian University, National Key Laboratory of Science and Technology on Tunable Laser, Harbin Institute of Technology, published an academic papers T-type cell mediated photoacoustic spectroscopy for simultaneous detection of multi-component gases based on triple resonance modality
Oil-immersed power transformer is one of the most important insulation equipment in modern power distribution and transmission systems. Simultaneous measurements of the dissolved gases in insulating oil, such as carbon monoxide (CO), methane (CH4) and acetylene (C2H2), can represent a suitable solution in early diagnosis of overheating, arcing and partial discharge failures of power transformers . Transformer fault can mainly be divided into overheating fault and discharge fault. The content changes of CO, CH4, and C2H2 are the main indicators of transformer failure. Overheating fault includes bare metal overheating, solid insulation overheating and low temperature overheating. The bare metal overheating is characterized by the rising concentration of hydrocarbon gas, such as CH4 and C2H2. The sum of the above two gases accounts for more than 80% of the total hydrocarbon gas, and CH4 accounts for a larger proportion (>30 ppm). The concentration of CO (>300 ppm) strongly indicates the solid insulation overheating and the low temperature overheating in the transformer failure. When the transformer is in discharge fault, the C2H2 will increase dramatically (>5 ppm, 20%− 70% of the total hydrocarbon gas). Therefore, CO, CH4, and C2H2 are selected as the target analytes in this work. The traditional quantitative detection of multiple analytes, such as gas chromatographs, semiconductor gas sensors and electrochemical sensors, were limited in terms of real time monitoring, recovery time, poor selectivity and cross sensitivity. Photoacoustic spectroscopy (PAS)-based optical sensor platforms, which feature the advantages of high sensitivity, high selectivity, fast response, long lifetime and well-established sensing devices, have played an important role in the field of multi-component gas sensing. Various PAS-based multi-gas sensor modalities have been developed, such as Fourier transform infrared PAS modality, broadband detection based thermal emitters or blackbody radiators using several band-pass filters, the use of multi-lasers combined time-division multiplexing (TDM) methods , and multi-resonators with frequency-division multiplexing (FDM) schemes. Due to the relatively poor intensity of the broadband source, the weak photoacoustic (PA) signals were sensitively affected by the background noise, which was a major obstacle to highly sensitive detection.
A T-type photoacoustic cell was designed and verified to be an appropriate sensor, due to the resonant frequencies of which are determined jointly by absorption and resonant cylinders. The three designated resonance modes were investigated from both simulation and experiments to present the comparable amplitude responses by introducing excitation beam position optimization. The capability of multi-gas detection was demonstrated by measuring CO, CH4 and C2H2 simultaneously using QCL, ICL and DFB lasers as excitation sources respectively.
A schematic diagram of PAS-based multi-component gas sensor configuration equipped with the developed T-type PAC is shown in Fig. Three excitation laser sources, including a DFB ICL (HealthyPhoton, model HPQCL-Q), a DFB QCL (HealthyPhoton, model QCQube) and an NIR laser diode (NEL) emitting at 2968 cm− 1, 2176.3 cm− 1 and 6578.6 cm− 1, were employed to realize the simultaneous detection of CH4, CO and C2H2. The optical powers of the ICL, QCL and NIR laser diode measured by a thermal power meter (Ophir Optronics 3 A) at the target absorption lines were 8 mW, 44 mW and 32 mW, respectively. All the laser sources were driven by tuning the current and temperature control.
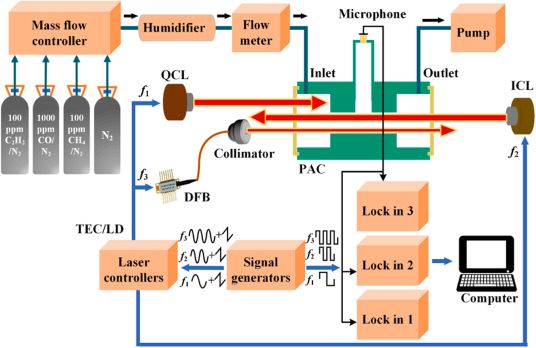
Fig. The schematic diagram of multi-resonance PAS-based gas sensor configuration equipped with the developed T-type PAC for multi-component gas simultaneous detection. Operating pressure: 760 Torr.
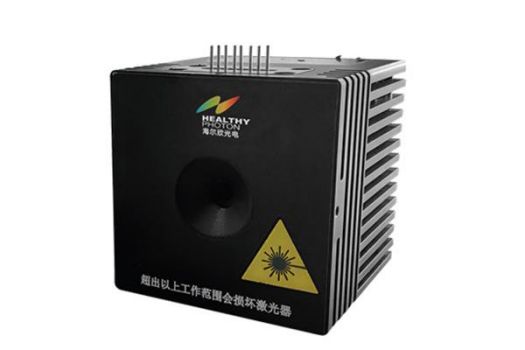
HealthyPhoton, model HPQCL-Q
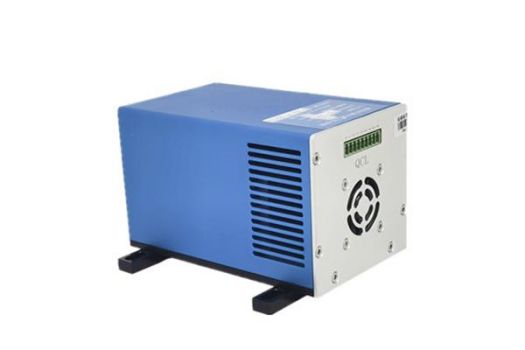
HealthyPhoton, model QCQube
Conclusions
A T-type cell based multi-resonance PAS gas sensor was established and verified to be capable of multi-component simultaneous ppb-level detection. By the FEA simulation optimization and experimental beam excitation position design, the PA responses of the three designated resonant frequencies are comparable which guarantees the high performance of multiple trace gas detection simultaneously. The three combustible species of CO, CH4 and C2H2 were selected as target gases for the simultaneous detection verification using a QCL (4.59 µm, 44 mW), an ICL (3.37 µm, 8 mW) and a NIR laser diode (1.52 µm, 32 mW) as incident beams. The SNR for F1 mode with the beam irradiating on the buffer wall was increased by 4.5 times than that of passing through absorption cylinder. The experimental MDLs (1σ) were achieved as of 89ppb (CO), 80ppb (CH4) and 664ppb (C2H2) have been acquired, respectively, corresponding to the NNEA coefficients of5.75 × 10−7 cm−1 W Hz−1/2, 1.97 × 10⁻⁸ cm−1 W Hz−1/2 and 4.23 × 10⁻⁸ cm−1 W Hz−1/2. An improved humidification investigation regarding cross-sensitivity analysis provides a better understanding of PAS sensors in humidity relaxation related effects. This developed PAS modality of utilizing a single PAC and a single detector for multicomponent gas sensing exhibits unique potential for early diagnosis of power transformer failures.

Fig. 1. Simulated spectral distribution characteristics of CO, CH4 and C2H2 based on HITRAN Database. Temperature and pressure: 296 K and 1 atm respectively.
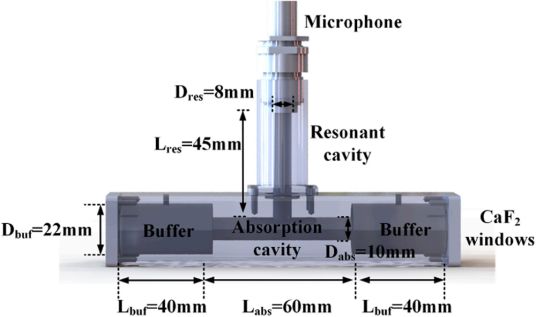
Fig. 2. Schematic structure of the developed T-type PAC.
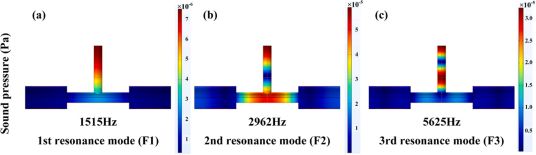
Fig. 3. Simulated sound pressure distribution of T-type PAC model for the three selected resonance modes by FEA method. Color bar: Simulated sound pressure (Pa).
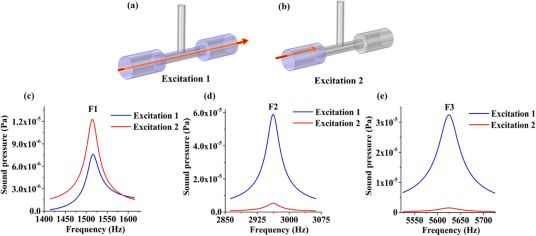
Fig. 4. Simulation results of the T-type PAC acoustic characteristics with the incident beam position optimization. (a) and (b): Two different incident ways of the excitation beam; (c), (d) and (e): The simulated pressure amplitude response vs. frequency for F1, F2 and F3 detection, respectively.
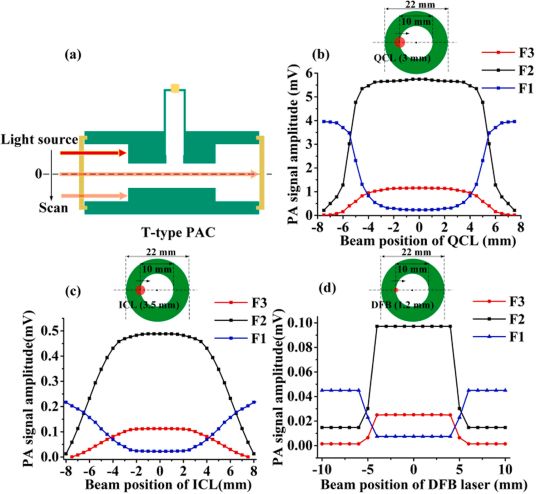
Fig. 6. The experimental results of PA signals for different resonance modes by scanning the incident excitation beam. (a) Schematic diagram of the light source scanning process in the T-type PAC. Dashed line: Central axis. (b) The PA amplitude of 100 ppm CO vs. the beam position of ICL source. (c) The PA amplitude of 50 ppm CH4 vs. the beam position of ICL source. (d) The PA amplitude of 50 ppm C2H2 vs. the beam position of DFB laser diode. Insert: The irradiated surface of PAC.
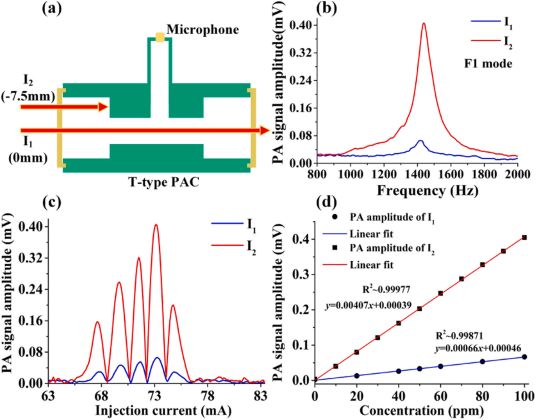
Fig. 7. The experimental results for CH4 detection with the incident beam position optimization. (a) Two different ways (I1, I2) of incident excitation beam using ICL for CH4 measurement; (b) The PA amplitude vs. frequency of F1 for the two incident ways; (c) The PA spectra of 100 ppm CH4 in the ICL tunning range using both incidence ways; (d) The PA signal amplitude of CH4 vs. gas concentration for two incidence ways.
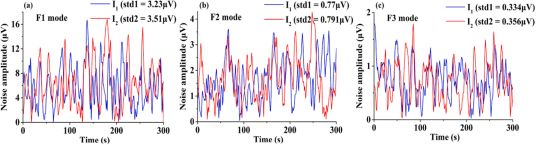
Fig. 8. Noise level analysis of F1, F2 and F3 modes for two incidence ways.
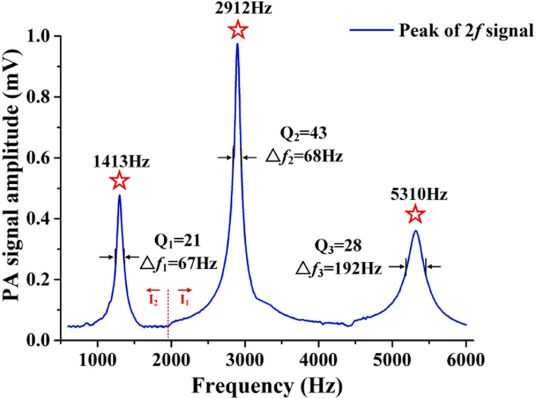
Fig. 9. Experimental frequency responses of the developed T-type PAC.
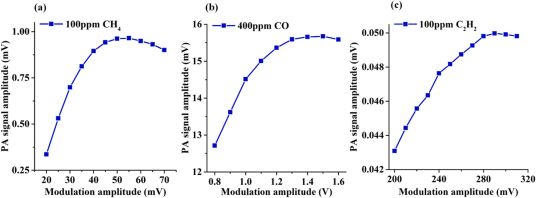
Fig. 10. The PA signal amplitudes vs. laser modulation amplitudes for multi-component gas sensing. (a) The ICL modulation amplitudes for 100 ppm CH4 detection; (b) The QCL modulation amplitudes for 400 ppm CO detection; (c) The NIR laser diode modulation amplitudes for 100 ppm C2H2 detection.
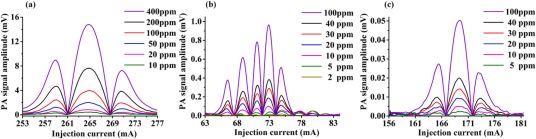
Fig. 11. The experimental results for simultaneous detection of multi-component gases. (a), (b) and (c): Measured 2f-PAS spectral scans of the CO, CH4 and C2H2 absorption features for F1, F2 and F3 modes, respectively.
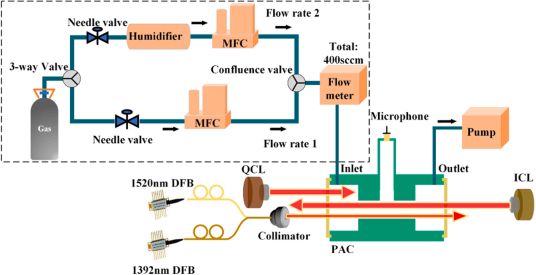
Fig. 12. Schematic of the improved humidification system for humidity control.
 Tel:+86-400 961 6990 Email:info@healthyphoton.com
Add:Room 305, Building 1, Zhongchuang Science Park, Jinyuan Road, Panhuo Street, Yinzhou District, Ningbo City,China
Tel:+86-400 961 6990 Email:info@healthyphoton.com
Add:Room 305, Building 1, Zhongchuang Science Park, Jinyuan Road, Panhuo Street, Yinzhou District, Ningbo City,China


